Contents – User guide for the Network Statement map service
3. View the Network Statement map service
4.2.3. Zoom map to origin scale
4.2.5. Maximize/minimize the map window
6. View data layer in the map – Layer list
6.1. Information about available data (Info-click)
The purpose is to describe functionality in the Network Statement map service and help users to become acquainted with the functionality in the system.
The user guide shall be used by those who uses the Network Statement map service, both internal within Trafikverket and external users.
3. View the Network Statement map service
The Network Statement map service presents available infrastructure on Trafikverket’s rail network. The Network Statement map service is published each year in conjunction with a new edition of the Network Statement. The Network Statement map service is updated when needed and important amendments of the data will be published on our website.
Information will be presented in Swedish and English.
The Network Statement map service can be reached via Trafikverkets webpage.
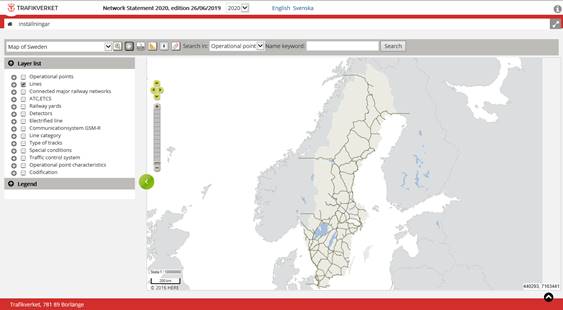
When opening the Network Statement map service Sweden will be shown with Sweden’s rail network.
Change between publishing years by selecting which year to be shown in the drop-down list on the top of the page.
![]()
There are two background maps available:
- Map of Sweden
- Lantmäteriets Topographical site map
Default Map of Sweden is shown. Change background map by using the drop-down list on the top left.
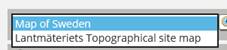
Map of Sweden is the general background map that is used by many systems within Trafikverket.
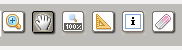
By using the tools in the toolbar above the map window you can navigate in the map. You get more detailed information about the tools when you hover over them.
There are several ways to zoom in map.
· Using the zoom navigation tool to the left in the map window, you can zoom in and out.
· Using the scroll wheel on the mouse, you can zoom in and out.
·
By marking the magnifying glass ![]() and click in the map, you can zoom in.
and click in the map, you can zoom in.
·
By marking the magnifying glass ![]() and drag a rectangle to the chosen zoom range, you can zoom in.
and drag a rectangle to the chosen zoom range, you can zoom in.
·
By marking the hand tool ![]() and double click in the map, you can zoom in.
and double click in the map, you can zoom in.
·
By marking the hand tool ![]() and hold down Shift and drag a rectangle to the chosen zoom range,
you can zoom in.
and hold down Shift and drag a rectangle to the chosen zoom range,
you can zoom in.
Activate the hand tool ![]() and press mouse button to pan through dragging in map.
and press mouse button to pan through dragging in map.
4.2.3. Zoom map to origin scale
Using the tool button ![]() you can zoom the map to origin scale so that the whole of Sweden
is shown.
you can zoom the map to origin scale so that the whole of Sweden
is shown.
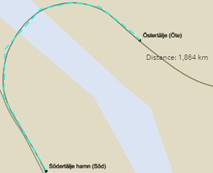
By choosing the tool “Measure in map” ![]() you can measure in the map, measuring units in kilometre. The ruler
will be marked grey
you can measure in the map, measuring units in kilometre. The ruler
will be marked grey ![]() and the mouse will be
marked with a blue circle. By clicking several times you can measure along a
curve. End your measure by double click, the distance will be displayed in the
map, or by choosing another tool in the toolbar.
and the mouse will be
marked with a blue circle. By clicking several times you can measure along a
curve. End your measure by double click, the distance will be displayed in the
map, or by choosing another tool in the toolbar.

4.2.5. Maximize/minimize the map window
To show the map window in fullscreen click
on the arrow symbol ![]() in the upper right
corner.
in the upper right
corner.
Revert to normal map window by clicking on
the arrow symbol ![]() again.
again.
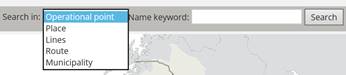
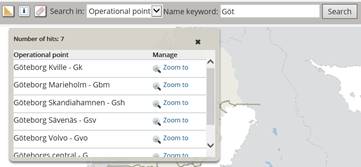
You can search in Operating point, Place, Lines, Route or Municipality. Select the desired option and enter parts of, or an entire keyword in the text box. Click “Search” to complete the search.
A dialog shows the search results sorted by name. The number of hits and information is displayed in the dialog. Click 'Zoom to' to zoom to the desired area in the map.
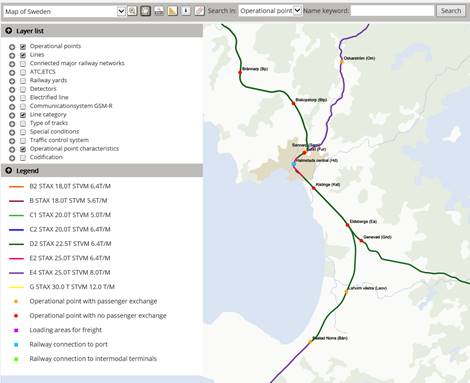
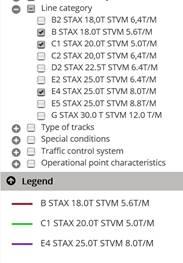
6. View data layer in the map – Layer list
In the left column there are data layers that can be displayed on the map. By ticking the checkbox in front of the desired layer, they are visualized on the map image. Below the layer list, a legend is displayed which shows visualized layers.
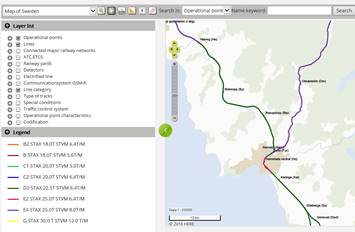
When selecting multiple data layers, graphics appear above each other in the map window. The layers follows a hierarchical order and is drawn from top to bottom. For example, Operating point is displayed on top of the layer of Line category. Be aware that if many layers are displayed in the map, it is the layer at the bottom of the layer list that is visualized at the top.
Expand a data layer to see which layers are available and to select which layers to display. You may have several data layers visualized in the map.
6.1. Information about available data (Info-click)
The button ![]() in
the toolbar can be used to see information about the current data layer on a certain
location in the map. The following layers can be used with Info-click:
in
the toolbar can be used to see information about the current data layer on a certain
location in the map. The following layers can be used with Info-click:
· Lines
· Operational point characteristics
· Special conditions
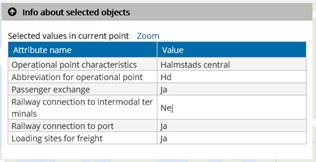
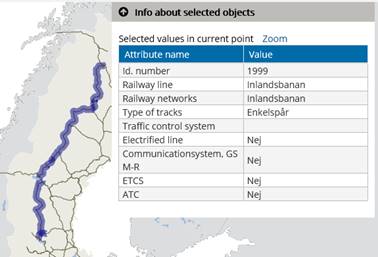
By selecting the i-button and click on an object in the map a dialog “Info about selected objects” will be displayed.
Information about Operational point characteristics:
If no layer is chosen, a general information will be displayed when using the info-click in map.
By clicking on the green arrow button, the left column will be hidden. Click again to display the left Layer list column again.
![]()

Please inform Användarstöd IT by mail to anvandarstodit@trafikverket.se when noticing problems with the Network Statement map service (in Swedish called JNB karta).
Any error in information or data, please send a mail to jnb.infrastruktur@trafikverket.se
Got stuck? Press <Ctrl+F5> to reload the Network Statement map service and reset settings.
|
Version |
Date |
Comment |
Name |
|
1.0 |
2018-10-18 |
Published version of the User guide for the Network Statement map service |
Ida Danielsson, IKTai |
|
1.1 |
2020-03-24 |
Changed of namn in Search: Changed of namn in Layer list: |
Ida Danielsson, IKTai |
|
1.2 |
2020-06-03 |
Sites changed to operational points. Operating sites (trafikplatser) changed to operational point characteristics. Section of line changed to Lines. |
Ida Danielsson, IKTai |